Given one dataset, find the number of NA values in each column for that dataset
Source:R/explain_NAs.r
explain_NAs.RdGiven one dataset, find the number of NA values in each column for that dataset. Outputs a sentence, a data frame, and two plots
explain_NAs(dataframe)
Arguments
| dataframe | Enter a dataset |
|---|
Examples
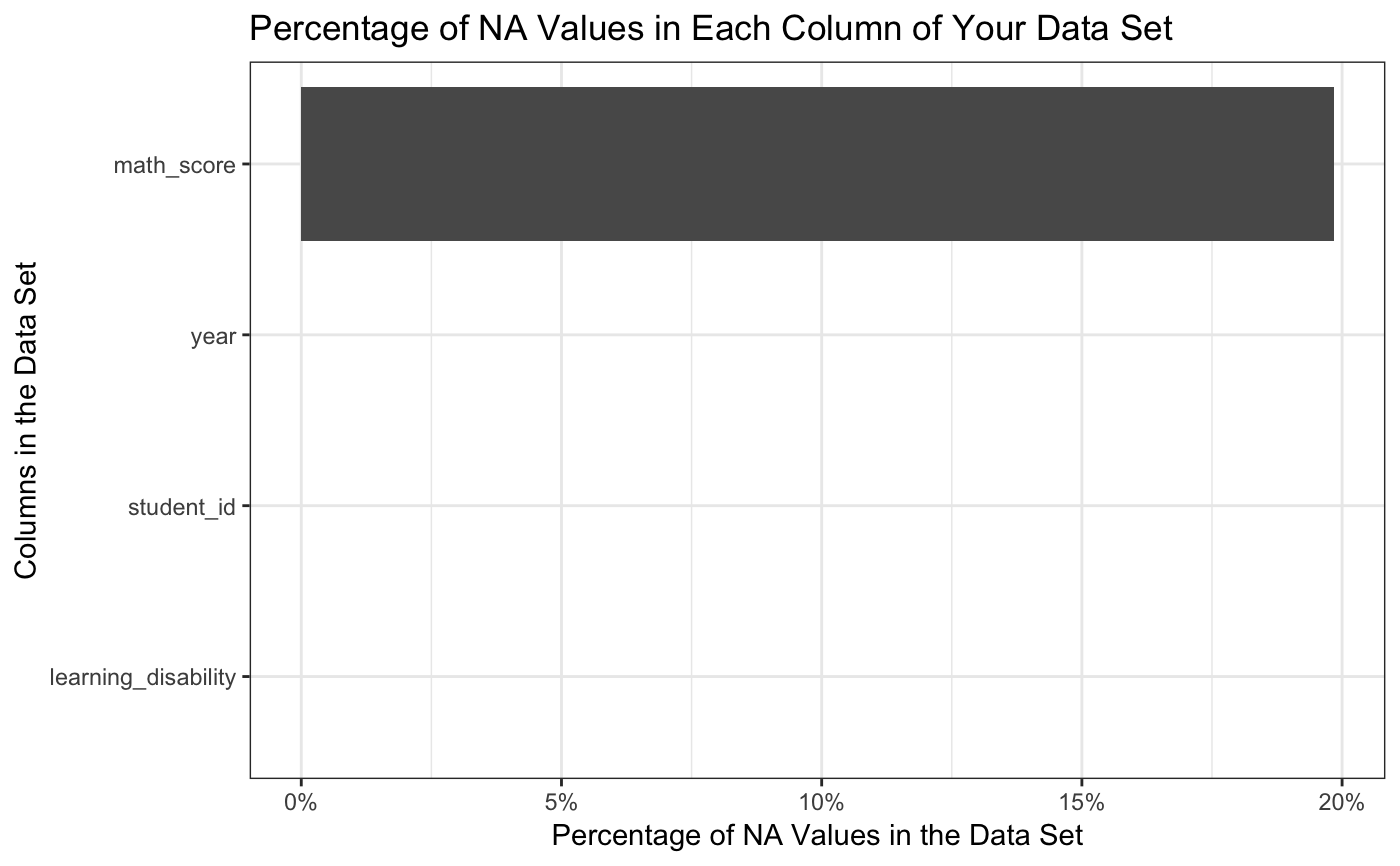
explain_NAs(math)#> [[1]] #> [1] "Here are the NA values in each column of the given dataframe, you have 24000 total rows in your dataset" #> #> [[2]] #> number_of_NA_values variable percentage_of_total_dataset #> 1 4761 math_score 19.84 #> 2 0 student_id 0.00 #> 3 0 year 0.00 #> 4 0 learning_disability 0.00 #> #> [[3]]#> #> [[4]]#>explain_NAs(math)[[2]] # gives only the second part, which is the data frame#> number_of_NA_values variable percentage_of_total_dataset #> 1 4761 math_score 19.84 #> 2 0 student_id 0.00 #> 3 0 year 0.00 #> 4 0 learning_disability 0.00explain_NAs(math)[[3]] # gives only the third part, which is the first plot